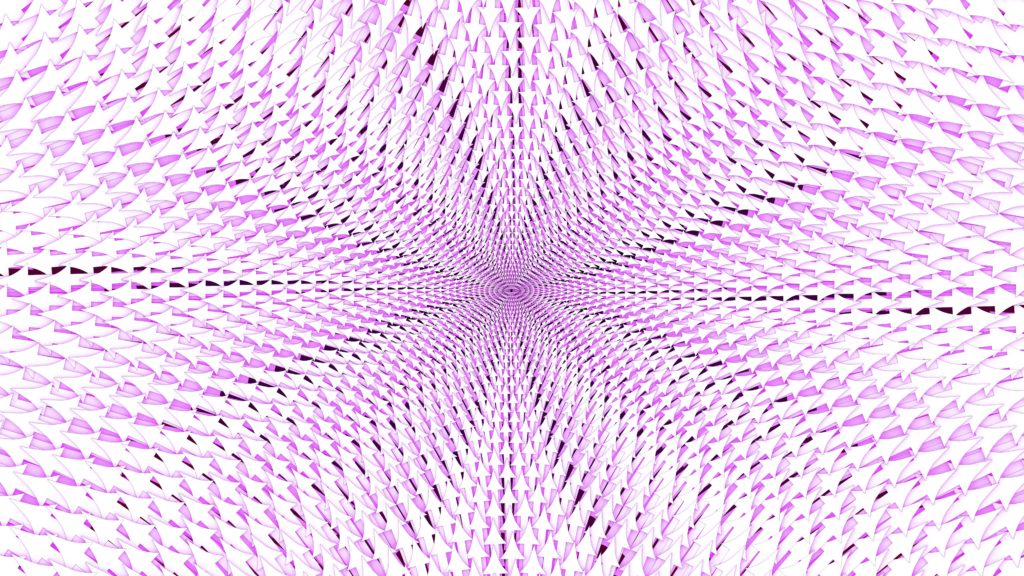
one of the most vexing things for me to illustrate is a planar vector field, especially when there is a singularity. there are so many distractions that arise from the canonical square-grid sampling that is endemic to software. here is an example with the linear vector field dx/dt = x ; dy/dt = -y

now for something completely different: the loxodromic grid, obtained by intersecting two circle’s worth of counterspinning spirals. you see these in sunflowers, pinecones, and the like. it seems as though nobody uses the term loxodromic grid (why was it in my head when i wanted to call this something? why did i know to use 137.5 degrees? intuition is a frustrating thing…). it also seems as though nobody ever plots vector fields on such a grid. pity, since that meant it took me a long time to figure out how to do it. but: it is worth the trouble…

i really like the fact that the sampling gets increasingly tight near the equilibrium. i am simultaneously disturbed and pleased that the stable and unstable manifolds are “hidden” (as it were). it is fitting that you have a hard time visually getting on and staying on the stable manifold, since that’s exactly what happens in the flow. even the visual artefacts are instructive: note that near the origin, the tiny vectors are packed in such a way as to suggest not a circle (where the sampling points are) but a squashed ellipse. this is right: the flow squeezes and stretches areas.
this is not a perfect plot. but it is satisfying to me, after having tried and failed to make square and hex grids not look awful.

